Search results
Jump to navigation
Jump to search
Page title matches
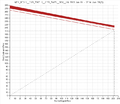
File:Graph SFT 1.PNG (700 × 604 (52 KB)) - 07:40, 29 January 2014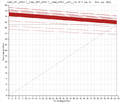
File:Graph SFT 2.PNG (700 × 604 (57 KB)) - 07:40, 29 January 2014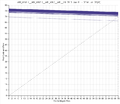
File:Graph SFT 3.PNG (700 × 604 (47 KB)) - 07:41, 29 January 2014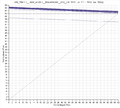
File:Graph SFT 4.PNG (700 × 629 (46 KB)) - 09:07, 29 January 2014


Page text matches
- *'''''Supply Curve Graph''''' == The Supply Curve Graph ==16 KB (2,474 words) - 08:51, 11 February 2014
- TIP: Use the Graph Nodal Demand profile feature (Graph Button on the Edit Node Data Grid) to get a quick visual check on changes y2 KB (403 words) - 15:12, 12 February 2014
- :''Graph Button'' The '''Graph Button''' on the '''''Edit Node Window'''''3 KB (484 words) - 09:36, 13 February 2014
- :''Offers Graph'' :Opens the Energy Offers Graph25 KB (3,838 words) - 15:07, 12 February 2014
- :''Demand Generation Graph'' :Opens the Demand, Generation Graph26 KB (3,995 words) - 10:47, 13 February 2014
- *Report and Graph Generation ! CSV/Graph/All/Selected Tick boxes10 KB (1,572 words) - 12:13, 12 February 2014
- :'''''Chart (Graph)'''''3 KB (445 words) - 08:23, 11 February 2014
- TIP: You can use the Graph Nodal Demand profile feature (Graph Button on the Edit Node Data Grid) to make a quick visual check on changes8 KB (1,337 words) - 13:21, 7 February 2014
- :Toggles between Grid and Graph display modes (Energy Offers only)3 KB (442 words) - 09:36, 13 February 2014
- ...ill now allow you to select Reserve Regions and Generators to report on or graph # supply curve graph issue fixed22 KB (3,723 words) - 11:51, 3 March 2016